A neighborhood library needs to summarize a fictional donation ledger for its monthly board meeting. The source sheet contains cash and book-sale contributions, one unclassified entry, and a receipt entered twice. A pivot table is an efficient way to group transactions, and Gemini in Google Sheets can help create one. However, a perfectly formatted chart will still total bad records precisely. This guide focuses on checking data definitions, duplicate transaction IDs, empty categories, and the relationship between an AI-generated summary tab and the live source.
Protect the source ledger and document its grain
Make a copy of the ledger before any AI-assisted action. Each row should represent one actual receipt, not one donor, event, or bank deposit. Add explicit transaction ID, date, category, amount, and review status columns. In this teaching example there are five records, including two copies of receipt R-204 and one category left blank. Those are deliberately invented records used to explain an audit method, not real financial results.
Write down whether refunds, in-kind gifts, and pledged but unreceived amounts belong in the report. Do not group amounts that use different units or accounting definitions. A missing category should remain visible as “Needs classification,” never silently become zero dollars or an assumed program label.
Open Gemini and request a reviewable pivot
Google documents Ask Gemini in Sheets on eligible Workspace or Google AI accounts. Its action list includes creating pivot tables; some action requests show a preview card before Apply, and configurable actions can expose Settings. Work in a native Google Sheet rather than expecting equivalent behavior in an uploaded Excel workbook. If Gemini is unavailable, an ordinary Sheets pivot table provides an auditable fallback.
Ask: “Create a pivot grouped by category with sum of received amount and count of transaction IDs. Preserve blank categories and show total rows. Do not change the source sheet.” Confirm the selected range, column headers and aggregation type in the proposed operation. The purpose is to generate a structure, not to endorse the underlying ledger.

Check the dimensions, aggregation, and missing rows
A pivot table can summarize sum, count or other aggregates. The wrong aggregate may appear plausible when data is small. For donation dollars, sum the numeric amount. To detect record volume, count transaction IDs separately. Include all date rows and explicitly inspect whether blank categories are grouped, hidden, or excluded in the proposed pivot.
If the source includes a row with no category, assign it a visible review flag rather than a guessed donor type. Use a small manual reconciliation: total the individual source amounts and compare that figure to the pivot grand total. A mismatch points to omitted rows, filters, or type errors. A match is useful but not sufficient, because a duplicate receipt can inflate both totals.
Use receipt IDs to expose double counting
The example’s duplicate receipt R-204 is a data issue upstream of the pivot. Grouping transactions by category does not deduplicate them. Filter by receipt ID, inspect original attachments, and determine whether a repeated row is accidental or describes a legitimate separate payment. Never delete a donor row only because the name and amount happen to match; repeat gifts are possible.
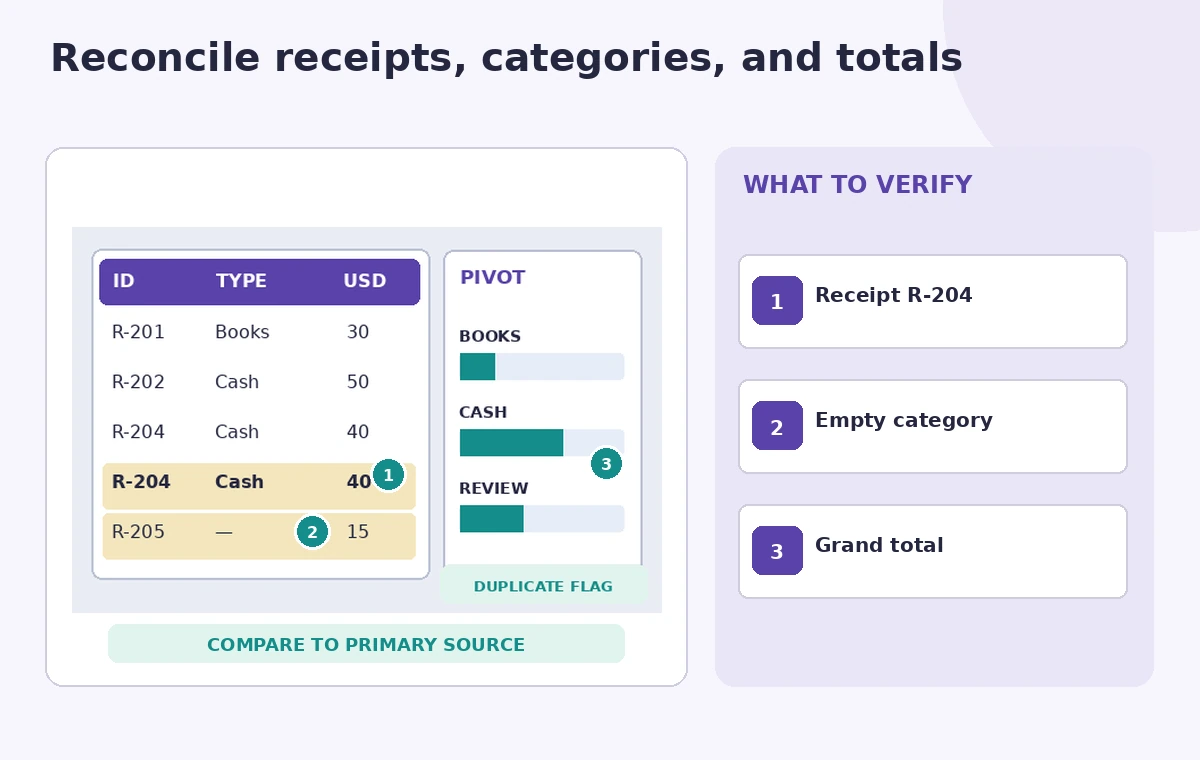
The comparison image shows a naive summary with two counts for R-204 versus a reviewed register that flags one transaction for investigation. The illustration is schematic and does not claim to show actual Gemini results. A reviewer should be able to reconstruct both counts from the original rows.

Inspect AI actions before applying them
Gemini may offer actions such as sorting, filtering, number formatting, or creating a pivot table. Read the action preview rather than clicking Apply reflexively. Confirm whether the planned change creates a new tab, changes the working range, or overwrites a user-maintained summary. Keep a duplicate of the workbook and use Undo only while the action is still reversible.
A pivot is a report of the recorded data, not a substitute for financial controls. If a payment was entered twice, the AI cannot decide from column values alone whether it represents two receipts or one mistaken duplicate. Route uncertain rows to the treasurer before declaring the month closed.
Treat refreshed data and exports as separate questions
An AI-generated chart can have a new underlying data tab, and Google explicitly cautions that charts generated through Gemini may not track future changes in the original source range. Pivot table behavior and refresh settings should be inspected in the current file rather than assumed from the chart interface. Add a visible “reviewed through” date to the board report and retest the numbers after new receipts arrive.
Do not present a previously exported snapshot as a live ledger. If the category coding rules change, document the revision and regenerate a comparable report. Preserve both the raw transactions and the calculation definitions so a future reviewer can reproduce the result without using the same AI assistant.
Validate financial wording in the board note
An amount on the chart is not automatically available cash. Separate received, restricted, pledged and refunded amounts according to the organization’s own bookkeeping rules. Draft a board sentence that makes those definitions clear and states the audit status: “Preliminary totals exclude unresolved duplicate review.” Avoid asserting a final audited number just because a pivot exported successfully.
Use neutral category names and never expose donor identities on a public board slide without permission. Where the ledger contains personal contact details, generate summaries from a minimal working copy with those columns removed. A numerical grouping has no need to see addresses or private donation notes.
Perform the three-point reconciliation before sharing
The final checklist examines the category field, the duplicate receipt, and the grand total. Compare the count of source rows with the pivot count and identify every excluded or flagged row. Have a treasurer verify the retained records against receipts, then mark the report reviewed with an explicit scope and date.
If errors remain open, deliver a provisional table with a separate exception list instead of polishing away the uncertainty. This is a more defensible outcome than a colorful dashboard whose totals cannot be tied to individual receipts.
How We Research
For this article we reviewed named official product documentation: Google Docs Editors Help, Collaborate with Gemini in Google Sheets; Google Docs Editors Help, Create and use pivot tables. We checked the documented interface, eligibility, action limitations, model behavior, and available recovery options as of November 2026. The article uses a hypothetical editorial scenario with invented records and illustrative artwork rather than a real login, paid tool run, user dataset, listening test, performance benchmark, or measured image restoration. We did not verify access to any individual subscription. Our review method was to map each proposed result to a primary record, identify decisions requiring a qualified human, and avoid promising AI accuracy not demonstrated by the vendor documentation. Before applying this method in production, verify the current release, permissions, source integrity, and organization data-handling rules.
Frequently Asked Questions
Google documents a pivot-table action in its Gemini in Sheets capabilities, subject to account access and current interface availability.
No. Investigate repeated transaction IDs against receipts before treating totals as final.
Retain it as visibly unclassified until a responsible person reviews the transaction.
Not necessarily. Google warns that generated charts may rely on a separate tab and not respond to source changes.
No. It can reconcile recorded rows while still including an accidental duplicate or misclassified entry.