
A community food pantry exports a weekly delivery log containing delivery IDs, sites, dates, box counts, and a separate note for returned boxes. A coordinator wants totals by distribution site, but a duplicated export row could make the monthly total look larger than the actual deliveries. Gemini in Google Sheets can help configure a pivot table; it cannot decide which operational record is authoritative. The fictional records and diagrams here illustrate a verification workflow, not a live test of Google’s model or any real pantry data.
Define a precise question and counting unit
Start with a question that can be answered from the approved register: ‘How many food boxes were delivered to each site during October?’ This means sum the numeric boxes-delivered field, not count households, unique volunteers, or rows. Record the reporting period and how returns are represented. A pickup attempt is not a completed delivery, and an order for twelve boxes is not proof of receipt. State whether cancellations and zero-box records must remain visible for review. Write the expected column names and one independent reconciliation rule before asking Gemini to build anything.
Prepare a clean, reversible source sheet
Make a working copy of the exported data; do not overwrite the original delivery file. Include an opaque delivery ID, site code, actual delivery date, signed or approved box count, and delivery status. Preserve IDs such as ‘0031’ as text. Scan for blank site fields, mixed date formats, same ID on multiple rows, and returns entered as negative counts. Do not silently delete a duplicate: one ID might reflect a corrected version that needs supervisory review. Place any unresolved entries on a review tab with a reason, owner, and evidence link.

Ask Gemini for a limited pivot configuration
On desktop Google Sheets, open Ask Gemini and use a narrow prompt such as ‘Create a pivot table that sums Box_Count by Site for completed October deliveries; do not change the source tab.’ Google’s help documents a new pivot-table action and an action preview card. Inspect the proposed rows, values, filter, and source range before choosing Apply. Check whether Gemini selected COUNT of IDs instead of SUM of box counts. If the action is unavailable under your Workspace or Google AI plan, create the pivot manually using Insert > Pivot table and the same review criteria.
Inspect the range, filter, and aggregation
A visually tidy pivot can still be wrong. Confirm the range includes the final delivery row and excludes instructional examples, subtotal rows, and the duplicated report footer. In the pivot editor, use Site as rows and the numeric Boxes Delivered column as values with SUM. Apply a status filter that includes completed deliveries only, and confirm the chosen date field uses the delivery event, not the record creation date. The diagram depicts a plausible configuration error; it does not claim a specific Gemini output. Take a screenshot or note of settings for your internal audit, not as proof of data validity.
Reconcile a known duplicate before sharing totals
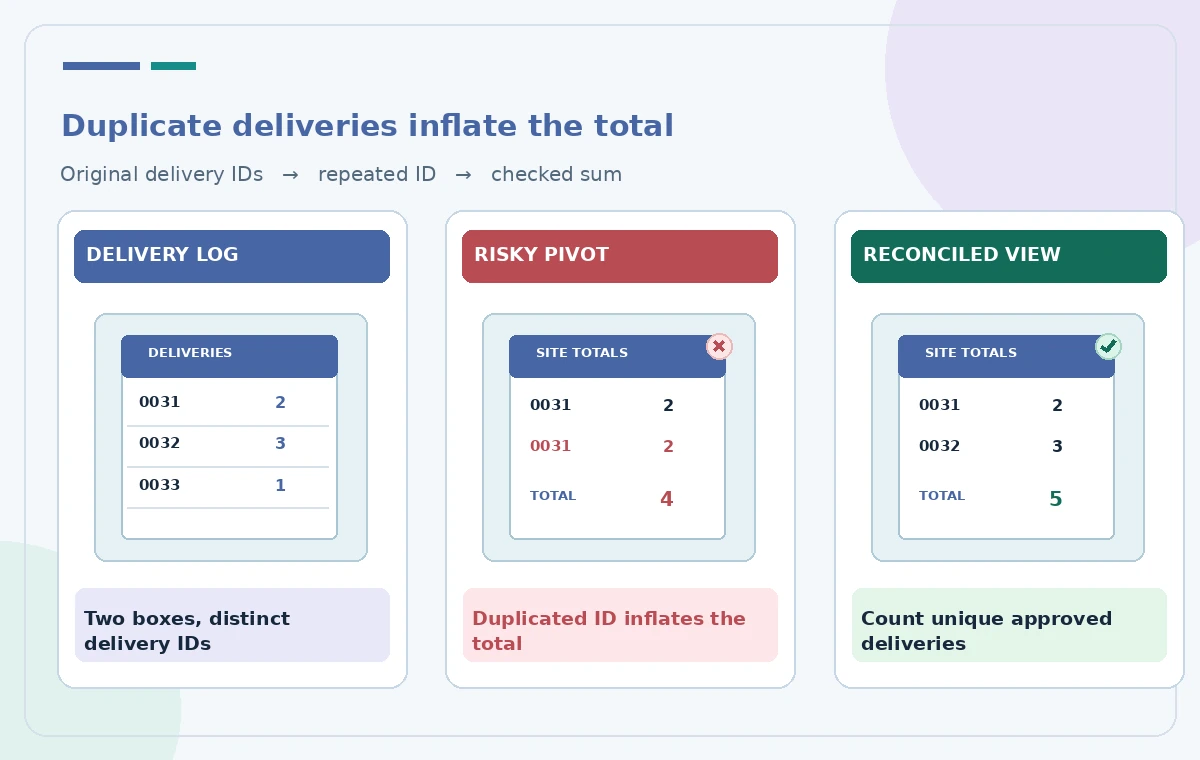
Imagine the sample register has delivery ID ‘0031’ once in the confirmed ledger and a second time from a repeated CSV import. A risky pivot adds two boxes from both rows, while the reviewed calculation includes only the authoritative delivery. Resolve the duplicate at source or with a documented approved exclusion, not an ad hoc hidden row that a colleague may forget. Compare the pivot grand total to a separately calculated filtered SUM over accepted transactions. If totals differ, stop and trace the first divergent site before drafting a report.
Check negatives, nulls, and apparent zeroes
Returns and adjustments deserve their own policy. A negative two-box correction may be legitimate, but a negative delivery quantity might also signal a data-entry error. Blank values must not be treated as confirmed zero deliveries. Review numeric types, rounding, unexpected text in number cells, and local date conversions; a U.S. date like 10/11 is ambiguous in some imports. Show count of missing fields and status-excluded rows beside the pivot so the total is not presented as complete when source quality is uncertain. Require documented resolution for material exceptions.
Keep people and locations out of the public report
Food assistance logs can contain contact and eligibility details that do not belong in a shared analytics sheet. Use aggregated site codes and box counts; avoid including recipient names, addresses, phone numbers, or case notes in prompts or visual examples. Ask the organization which account and sharing settings permit Gemini processing. Google feature availability depends on an eligible Workspace or AI plan and administrator controls. Restrict the review sheet to staff who need it, and publish only approved, non-identifying totals after a supervisor verifies the numbers.
Add a readable chart without changing the math
If a chart accompanies the pivot, label the measure ‘Boxes Delivered’ and the period explicitly. Do not label a count of boxes as ‘Families Helped’ or imply one box equals one household. Sort sites consistently and show the units on the axis; use plain-language table text for readers who cannot interpret the chart visually. For a small number of sites, a captioned table may be clearer than bars. Tie each published figure to the reviewed pivot, the underlying filtered register, and the report revision so corrections can be tracked.

Sign off with an exception and totals log
Keep a brief audit record: original export date, source-owner approval, site list, status filter, duplicate IDs reviewed, exclusions, independent total, reviewer, and version. Make the acceptance criteria explicit: grand total matches the checked ledger, each site subtotal matches its filtered rows, and no unresolved negative or blank records affect the headline. If a later import changes the underlying data, refresh the pivot and rerun comparisons before reusing the chart. This is a teaching workflow, not assurance that AI has validated operational data; accountability remains with the pantry staff.
How We Research
We reviewed these named official developer resources: Google Docs Editors Help — Collaborate with Gemini in Google Sheets; Google Docs Editors Help — Create and use pivot tables. We checked the documented feature entry points, eligible platforms, administrator or licensing controls, and known sharing or source limitations against the tutorial steps. Editorial examples were designed as hypothetical failure-mode checks, not reports of hands-on testing. We did not have a live account, source files from a museum or nonprofit, user interviews, access to private records, or measured model outputs. Every illustration is original explanatory artwork rather than a vendor screenshot or measured before/after result. Features and entitlements can change. A responsible editor should confirm current product documentation, applicable organizational policy, and the original evidence before putting the workflow into consequential use.
Frequently Asked Questions
Google documents a pivot-table action in Gemini for eligible accounts. Review the action preview and settings before applying it.
Use SUM on delivered box quantities for a boxes-delivered metric; use counts only when the question truly asks about distinct qualifying records.
Investigate the source and document the authoritative record before finalizing any total. Never silently delete it.
No. Validate the source range, filters, duplicates, dates, numeric types, and an independent reconciliation.
Avoid unnecessary personal data in AI prompts and published reports; follow the organization’s approved access policy.