
A public library needs a one-paragraph monthly report about its adult learning sessions. The data model has separate counts for event registrations, check-ins, and room capacity. A confident AI summary might accidentally call a check-in total a percentage increase or compare current attendance with an incomplete prior month. Power BI Copilot can produce a narrative based on report visuals, but a usable summary requires a defined denominator, visible filters, and a human reconciliation step. This fictional scenario illustrates a disciplined reporting workflow, not an observed test of a Microsoft tenant or a measured accuracy score.
Choose the correct measure before choosing words
Define the report question in one sentence: how many people actually attended eligible adult classes during the completed reporting month? Confirm that the source table has an attendance or check-in measure distinct from registrations and capacity. If the same person attends two sessions, decide whether the metric counts visits or unique people and label it accordingly. Preserve a written metric definition and the latest scheduled refresh timestamp. If a session was canceled, determine whether it should appear in the denominator. This preparatory step prevents a polished AI paragraph from concealing an ambiguous or incorrectly modeled statistic. Ask the data steward to confirm the model before sharing any narrative.
Check Copilot access, capacity, and report permissions
Microsoft documents Copilot requirements for Power BI, including administrative enablement, supported Fabric or Premium capacity, region settings, and suitable report permissions. Creating a narrative visual generally requires edit access; a person with read access may be able to ask for summaries in the Copilot pane instead. Do not tell readers to look for a control that their tenant cannot use. Ask the workspace administrator whether Copilot is enabled for the specific environment, and check the current Microsoft Learn access guide before promising a feature. If Copilot is unavailable, write a conventional report narrative from the same verified measures rather than purchasing a license on an assumption.
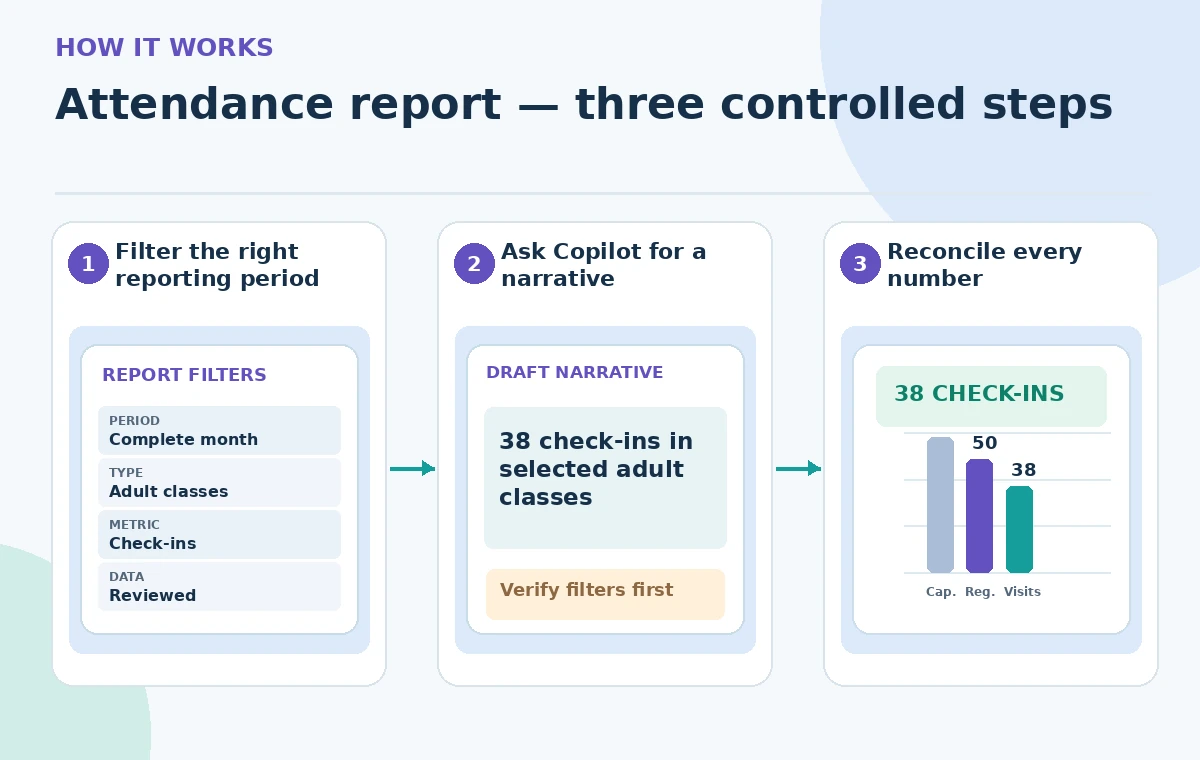
Prepare a page with unambiguous report visuals
Make a report page with monthly check-ins, session counts, and a comparison visual that clearly identifies the prior period. Use titles that say “attendee visits” rather than a vague “participants.” Remove unrelated slicers or record their state explicitly. If a report includes age-group data or protected demographic detail, choose an aggregated level that follows the library’s privacy rules. Test a blank filter state and a single-library filter state so a cached sentence cannot silently summarize the wrong branch. Record the selected month, filters, semantic-model name, and refresh date in the editorial worksheet. The chart is evidence; the AI paragraph is an interpretation that still needs checking.
Prompt for restrained language and cite the visual scope
In the Power BI report editing experience, use the documented Copilot narrative capabilities to request a concise account of the selected visuals. A focused instruction might read: “Describe attendee visits and session count for the selected complete month; state the reporting period; avoid growth percentages unless both periods and the formula are present.” Microsoft documents narrative summaries of report pages and selected visuals and more targeted prompts in the pane. Those instructions help constrain the writing but cannot guarantee mathematical integrity. If the model outputs a figure that does not appear in the visuals, trace it to an explicit measure before accepting it. Do not copy an attractive sentence straight into a funding application.
Audit denominators with a controlled example
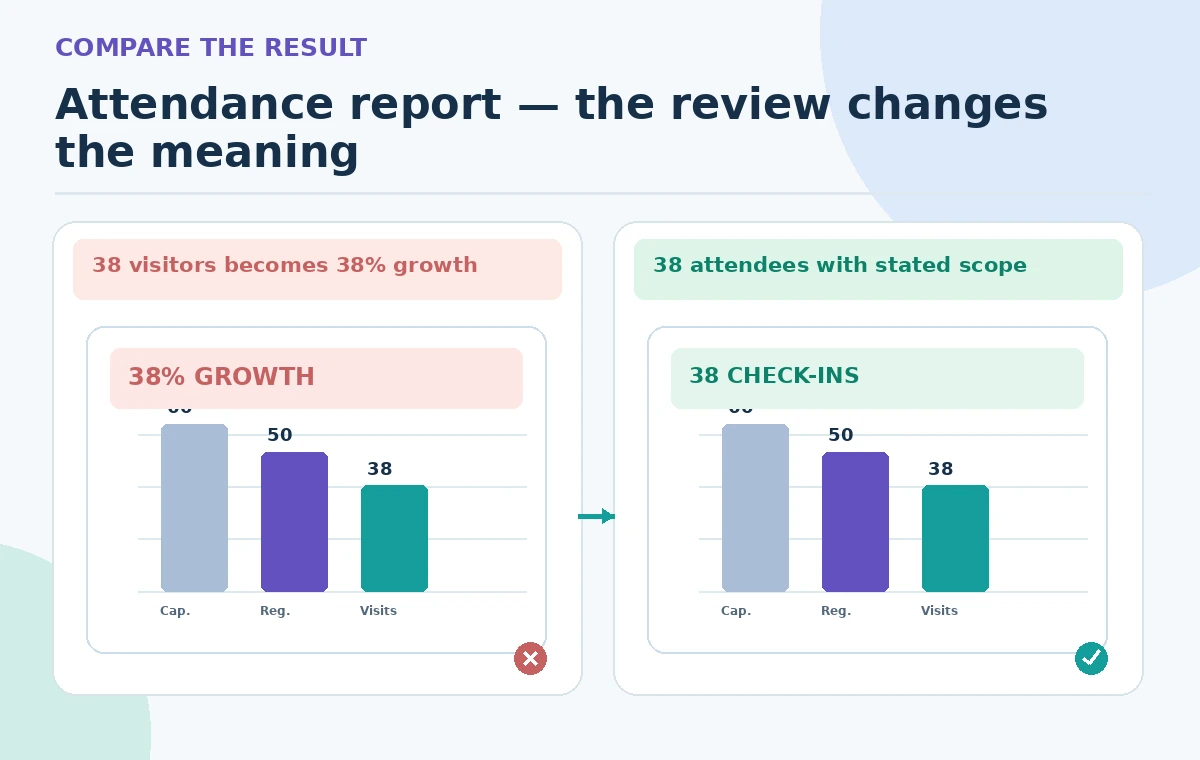
Suppose a training sheet uses invented sample values: 50 registrations, 38 check-ins, and 60 seats across sessions. The attendance total is 38 check-ins, not 38 percent growth; 38 divided by 50 is a check-in rate of 76 percent only if both figures use exactly the same event set and business definition. A month-over-month growth rate needs a verified previous-month baseline. The comparative illustration highlights how an unreviewed narrative can turn a count into an unsupported percentage. These figures are pedagogical numbers created for the diagram, not actual library results, Copilot outputs, or a benchmark of model accuracy.
Check slicers, security scope, and refresh timing
A statement that was true for all branches may be false when the report is filtered to a single library. Microsoft documentation notes that Copilot summaries of a visual reflect filter and slicer state as well as row-level security. Re-open the report in a suitable review role, verify the visible filter selections, and check whether underlying data have refreshed since the draft was written. If the model contains imported data, note the refresh boundary in the report rather than implying live operational counts. Test that the narrative does not reveal suppressed small groups or expose detail not authorized for the intended audience. Secure access is part of editorial accuracy, not an afterthought.
Reconcile each sentence against its measure
Treat the narrative as a list of claims to verify. For every number, note the visual title, measure name, calculation definition, filter state, and source date. For every comparison, check numerator, denominator, time range, and whether both periods contain finalized records. Watch for words such as “doubled,” “highest,” and “most successful,” because they imply evidence beyond a plain attendance count. If one figure is disputed, replace the clause with a neutral description or delay that sentence. An editor should be able to reproduce the calculation without asking Copilot to explain its own output. Keep corrections in an ordinary tracked report draft.
Rewrite the final narrative for the actual audience
A board member may need a two-sentence summary and caveat; an internal coordinator may need a fuller explanation of missing check-ins and inconsistent category labels. Preserve the original question and metric definition when adapting tone. For example, “The library recorded 38 attendee check-ins across the selected sessions” is safer than “Attendance rose 38%” when growth was not calculated. Do not equate higher check-ins with an impact outcome unless the program has a defined evaluation design. Add a footnote for canceled sessions or a known sign-in gap. Publishing a narrative should not change the underlying model or automatically approve budget decisions.
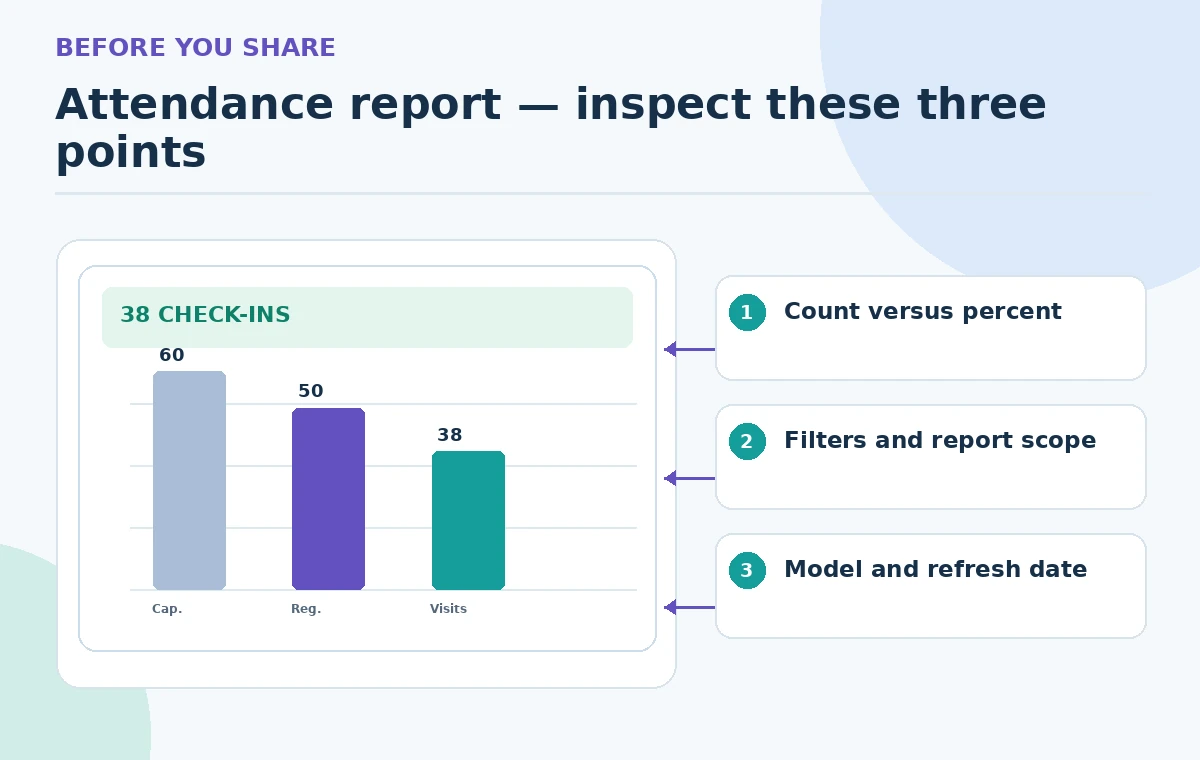
Document the methodology and release approval
Archive the report URL or approved export, selected slicer state, measure definitions, refresh timestamp, draft narrative, calculation audit, and final reviewer decision. Ask a second person to check the interpretation before an external report is released. If the page or model changes materially, regenerate the narrative and repeat the claim reconciliation; old AI prose should not remain beside new charts. This guide did not access a Power BI tenant, inspect a live library semantic model, or measure Copilot’s performance. Its numbers and visuals are illustrative and designed to demonstrate the difference between a legitimate count, a rate, and unsupported trend language.
How We Research
This article uses named first-party documentation: Microsoft Learn — Write Copilot prompts to create narrative visuals and Microsoft Learn — Copilot for Power BI overview and Microsoft Learn — Summarize a report with Copilot. We checked the described capabilities, availability notes, current feature naming, permissions, and workflow limitations, then built an independent fictional editorial scenario for verification. The example materials, images, outcomes, and approvals are conceptual, not the result of operating a customer account. We did not execute a model run, inspect private records, measure accuracy, or certify the depicted activity. Readers should confirm the latest vendor instructions and organizational permissions before applying the workflow.
Frequently Asked Questions
No. Microsoft documents Fabric or Premium capacity, administrator, region, and permission requirements.
Typically a narrative visual requires edit permission; eligible viewers may ask for summaries in the Copilot pane.
No. Growth needs a valid comparison period and a specified denominator; a count alone proves neither.
Microsoft documents that visual summaries reflect selected filters and security scope. Review the exact context used.
No. Check every quantitative claim and comparison against the named source measure.