
A fictional library tracks four small workshops. Attendance has been reported for three: 18 people at printmaking, 24 at book repair, and zero at a still-open but unattended reading session. The fourth workshop has a blank cell because its attendance sheet has not been delivered. A chart that quietly treats that blank as zero would make the wrong claim about participation.
Analyze Data in Excel can generate suggestions and visuals from tabular data, including answers to natural-language questions. It is a starting point, not a substitute for defining a missing-value policy. The examples below are invented instructional rows; there are no real library records or measured product outputs behind the diagrams.
Build a source table that distinguishes unknown from zero
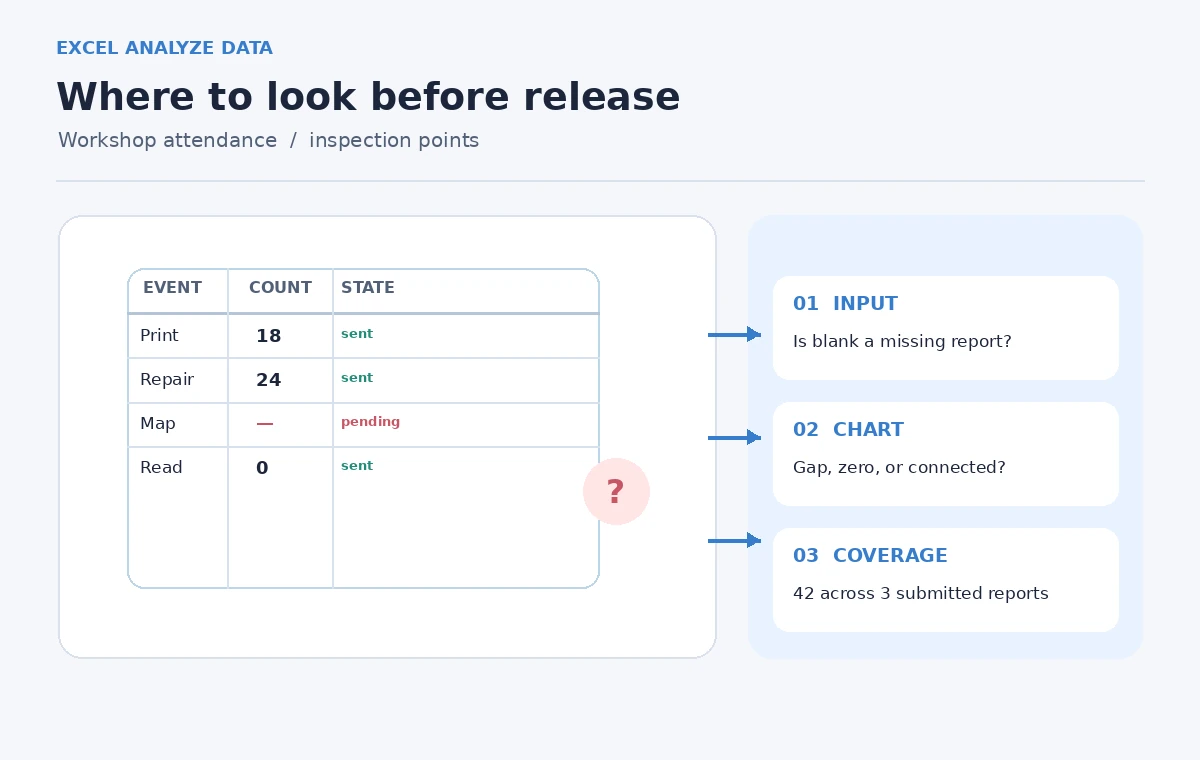
Start with an Excel table whose headers are unique, single-row labels: Workshop, Date, Attendance, and Reporting Status. For this hypothetical sheet the counts are Printmaking 18, Repair 24, Reading 0, and Mapmaking blank. Set Mapmaking’s reporting status to “Not submitted.” The Reading count is an observed zero, not a default value; staff must be confident the event went ahead and nobody attended.
Do not type 0 into an empty numeric cell just to make a graph look complete. A missing value means measurement was not supplied; a zero means a measurement was supplied and its value was none. If a workshop was canceled entirely, add an explicit status such as “Canceled” and decide whether it belongs in the denominator. Combining cancellations, missing reports, and genuine zero turnout destroys the meaning of the analysis.
Prepare the worksheet for Analyze Data
Microsoft recommends a clean, rectangular table with one header row and no merged cells. Select a cell inside the range and create an Excel table if needed. Check for accidental subtotal rows, notes at the bottom, text-formatted dates, and duplicate workshop names. The Analyze Data guidance warns that complicated nested data and string dates can undermine interpretation.
Save an untouched copy before editing the reporting sheet. Use an explicit status column rather than substituting a textual “unknown” string into a numeric count column. When a number arrives later, enter it in the attendance column and change the status in the same reviewed operation. This keeps numeric analysis possible while recording why a previous value was blank.

Ask a question that states the denominator
With a supported Microsoft 365 Excel installation, select Home and then Analyze Data. Instead of asking only “How many attended?”, specify “Compare reported workshop attendance by workshop, excluding rows marked Not submitted.” Natural-language queries are exploratory; depending on the workbook and feature support, Analyze Data may suggest a chart or PivotTable rather than exactly the visualization described.
Always check the generated fields and aggregation. A sum of 42 for two positively attended events can be mathematically accurate yet misleading if it is presented as a complete total across four workshops. The correct narrative for the hypothetical source is: three workshops reported attendance, one has no report; the observed attendance across the reported rows totals 42. That claim still requires direct spreadsheet arithmetic and a human review.
Review the chart treatment of empty cells
Microsoft documents chart options that can display empty cells as gaps, zeros, or connecting lines in relevant chart types. Choose deliberately rather than accepting the default display as a statement about the source. For a line chart of counts over time, a gap is often more honest for a truly missing report than a point dropped to zero or a line that implies an interpolated observation.
Different chart types handle blanks differently, and some options depend on version or subscription. Open the chart’s data selection settings and inspect hidden and empty cell handling where available. Also look for filtered rows, because a filtered-out workshop can vanish from a graphic. Treat every rendering choice as a presentation decision that deserves a note when it changes the apparent trend.

Compare an attractive wrong chart with a defensible one
Imagine the assistant’s first suggested plot shows Mapmaking at zero next to Reading at zero. The bars look tidy, but the legend hides a critical difference: Reading had a verified count of zero, while Mapmaking is unknown. The corrected view should leave Mapmaking unplotted or explicitly labeled “Report pending,” while keeping Reading at its actual observed zero.
A chart should not manufacture missing values to achieve visual symmetry. When sharing a report, use a small footnote such as “Attendance figures are limited to three submitted workshop reports.” Include the status column or a companion table so readers do not interpret a blank graphic space as a technical glitch. The visual comparison in this guide is an illustrative design, not an output captured from Excel.
Sanity-check averages, totals, and percentages
The three reported values are 18, 24, and 0, so their total is 42 and their mean is 14 among reported events. Dividing 42 by four workshops instead yields 10.5, a different metric that silently treats the missing fourth event as contributing nothing. Neither figure should be labeled “average workshop attendance” without a clear denominator and definition of inclusion.
If you later receive the Mapmaking attendance sheet, recalculate the total and mean and update the coverage note. Check that inserted tables or PivotTables refresh after source edits. A chart copied into a slide deck is not a living database; if the source changes, verify the exported figure again. A reviewer should be able to reconstruct every number from a named row and status.
Combine Tools With Verification
Know where the feature may not be available
Analyze Data is documented for Excel under qualifying Microsoft 365 subscriptions, with availability depending on language and rollout. Microsoft also lists constraints such as very large datasets, compatibility-mode workbooks, merged cells, and text-formatted dates. These are reasons to test the feature in the actual workbook before designing a process around an assumed button.
This workflow is still useful without Analyze Data. An ordinary table, pivot, or manually audited chart can preserve missingness as long as the input policy is explicit. Avoid presenting an optional analysis assistant as a mandatory step when a simple count and a reliable reporting-status column answer the organization’s question.
Release a report with explicit coverage
For the invented example, publish two statements together: “Known attendance: 42 across three reported workshops” and “One workshop has not submitted its attendance.” Show Reading as the actual zero and Mapmaking as pending. If the month is not finished, include a reporting cutoff date as well. That gives readers a defensible snapshot rather than an inflated claim of completeness.
Keep the untouched source workbook, the reviewed reporting table, and the chart used in the final brief. If someone challenges an apparent decline, you can show the missing source row immediately. The goal of Analyze Data is quicker exploration. The goal of the editor is that a clean-looking figure never makes a stronger factual claim than the underlying observations allow.
How We Research
On November 4, 2026, we checked the named official sources Microsoft Support: Analyze Data in Excel and Microsoft Support: Display empty cells, null values, and hidden data in charts. We reviewed Microsoft’s Excel Analyze Data and empty-cell chart documentation on November 4, 2026, distinguishing described capabilities from choices a reviewer must make. We designed a four-row hypothetical table and independently checked the arithmetic for the reported values 18, 24, and 0. We did not operate a licensed Excel session, obtain Analyze Data results, or benchmark its chart suggestions. Controls, language availability, and workbook behavior may vary by subscription and version.
Frequently Asked Questions
A blank records absent evidence; zero is a completed measurement showing that nobody attended.
No. The analyst must check included rows, status fields, aggregation, and the exact meaning of a requested metric.
Among the three reported workshops it is (18 + 24 + 0) / 3 = 14, not 10.5 across four events.
Excel offers multiple empty-cell display treatments in supported chart types; inspect the chart settings and source values.
No. Conventional chart and pivot tools are sufficient when the source data and missing-value policy are reviewed.