A chat-based AI data analyst can summarize a CSV, write calculations, and produce a polished chart before anyone has checked whether the underlying columns mean what they appear to mean. This is a quality-control guide for analysts and small teams, not another ranking of chatbots. You will build a reproducible pre-analysis audit, reconcile one important total, and attach an exception report to every model-generated conclusion. The instructions are designed for common CSV tables; they do not claim that LabFin ran your data or tested a vendor against a benchmark.
Write a question and a data contract
Start with a question that could be falsified: “What were net orders by month, excluding canceled records?” That determines which fields you need. Define one row as an order, order line, customer, or event, and distinguish units explicitly. A column named `amount` might represent USD, cents, or local currencies. If multiple types share one CSV, document the grain before adding sums. Establish whether a missing timestamp makes a record invalid or merely ungrouped.
Create a minimal data contract: file name and version, expected columns, primary key, timestamp time zone, currency, row grain, allowed category values, null policy, and permitted personal information. The analyst owns these definitions, not the model. Exclude sensitive exports or anonymize them where company policy requires. A sophisticated prompt will not save an analysis built on contradictory row definitions.
Prepare a machine-readable CSV
The OpenAI data analysis guide recommends descriptive column headers and one record per row, avoiding blank separator rows or unrelated tables on one sheet. For CSV, preserve a UTF-8 export where possible, keep dates in a consistent format, and do not mix presentation-only subtotal rows with transaction records. Record the export time and the original system. Do not manually delete suspicious rows to make the charts look cleaner.
Before using AI, check that fields have stable types. A zip code or account identifier that begins with zero may need to remain text. Currency symbols and thousands separators require explicit parsing. A column with “N/A,” empty text, and actual null values may need a single missingness policy. Keep an unchanged raw copy and perform transformations on a named derivative so errors can be reproduced.
Profile nulls, duplicates and distributions
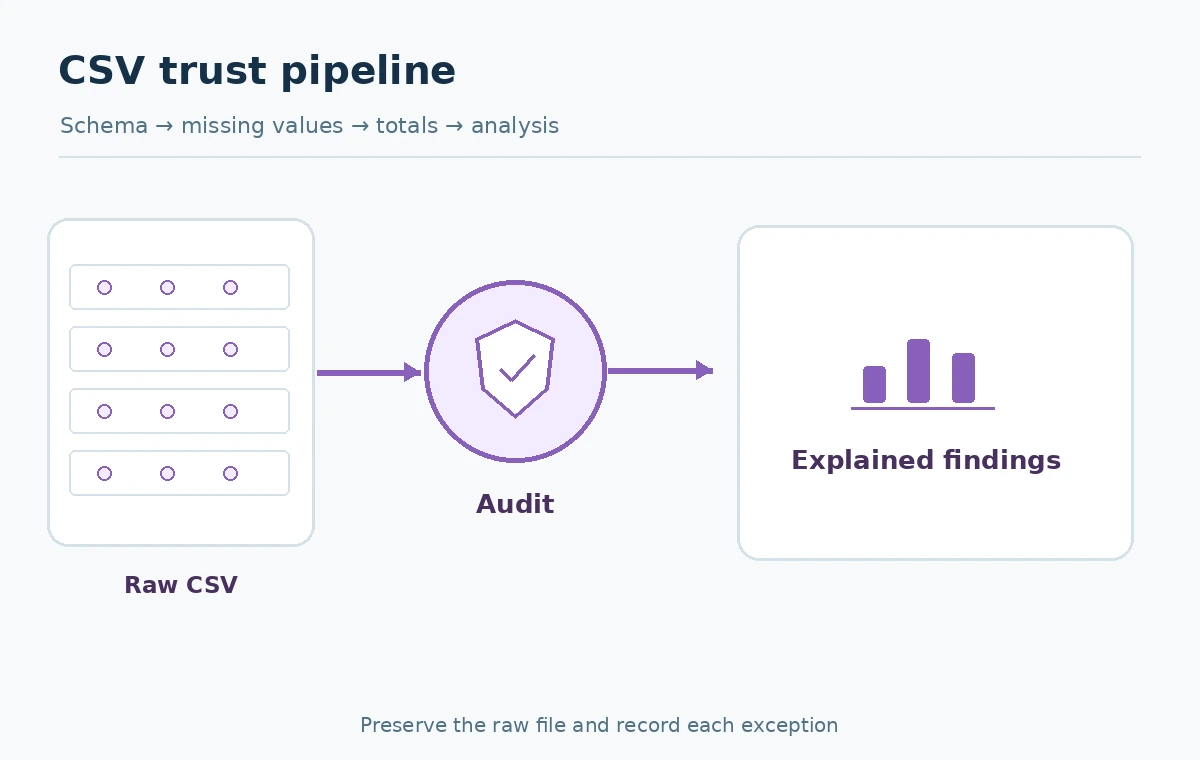
Make a preflight table for each column: expected type, observed type, missing count, distinct count, outlier rule and owner decision. In Microsoft Power Query, the data profiling tools expose column quality, distribution and profile information. Microsoft notes the default profile may use the first 1,000 rows; switch to entire-data-set profiling when feasible to avoid a misleadingly clean sample.
Check primary key uniqueness before joining tables. Look for duplicate exports of the same transaction, trailing spaces in category values, impossible dates, negative values where refunds are not expected, and extremely large numeric values. An outlier is a question, not automatically an error. Keep a separate exception register so a data owner can decide whether to correct, exclude, or preserve each case.
Ask AI for code and inspection, not intuition
Upload only data your policy allows and describe the data contract. A productive prompt says: “Inspect the schema, show row counts and missing values, identify duplicate keys, compute the requested monthly metric, and include the exact Python transformations. Do not drop rows without logging the reason. State every assumption.” OpenAI documents that ChatGPT data analysis can work with spreadsheets, calculate with Python, make charts, and show code or outputs, subject to the selected environment and account.
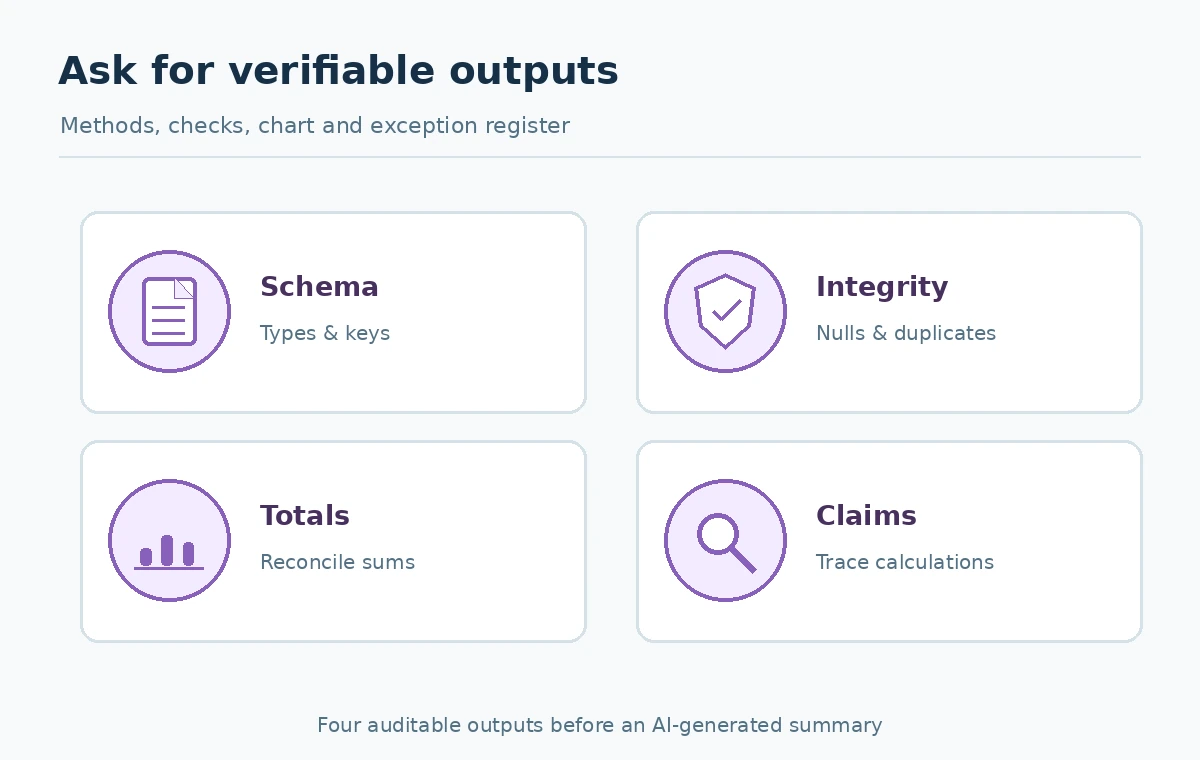
Do not accept an answer that skips straight to a growth narrative. Ask for `head` and `tail` samples, types, group counts, an exception table, and a methodology section. The assistant might use an incorrect date parse or select the wrong aggregation field. Having code and intermediate totals makes that failure visible. Treat its explanation as a proposed interpretation until the calculations have been checked.
Reconcile totals with an independent path
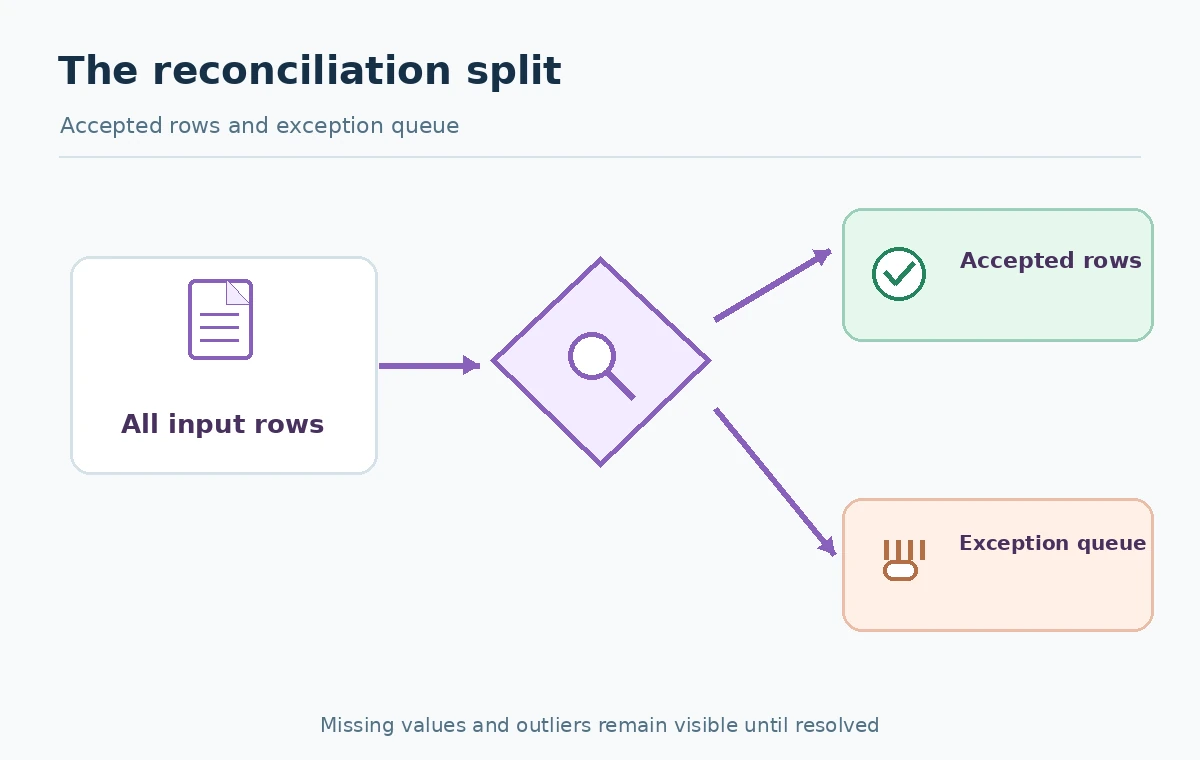
Choose one control total the source owner trusts: gross invoice value, successful orders, or ticket count. Compute that total separately using a spreadsheet pivot, a saved SQL query, or the reporting system’s authoritative export. Compare source total to cleaned-table total, then write an adjustment ledger for excluded, duplicated, converted or missing records. If the source sum is 10,000 units and validated exclusions are 250, the accepted total should be 9,750 units; these are hypothetical arithmetic examples, not observed performance data.
Reconcile at the same grain and filters. Two analysts counting orders versus order lines can both write correct code while reporting incompatible numbers. Check whether refunds, time zones, multi-currency rows, and canceled status are included consistently. Record the query or pivot steps so the process can be rerun when a new export arrives.
Design charts that preserve data meaning
Choose a graphic matched to the business question. A trend needs comparable monthly boundaries; a category comparison needs a sensible sorting and a visible unit; a scatterplot needs numeric axes with labels. Do not let the assistant imply a correlation proves causation or create a chart that omits inconvenient categories. Ask for the actual grouped table alongside every visual and note any suppressed records, imputed dates, or aggregate thresholds.
Review axis starts, denominator definitions, and whether a small subgroup contains too few observations to support a strong conclusion. If the assistant reports “growth,” request both period values and the exact percentage calculation. A chart title should describe the measure and scope, not advertise a takeaway. Readers must be able to reconcile a plotted point with rows from the clean dataset.
Write an exception-aware business summary
A decision memo should have four parts: the question, the verified number, the uncertainty, and the decision the evidence may support. For example: “In the accepted order table, month-over-month units rose; 3% of source rows remain under review for missing customer identifiers.” The percentage is illustrative; calculate your actual exception share from your own file. Do not bury exclusions in a footnote after a confident recommendation.
Ask the model to provide a claim-to-query map: each quantitative sentence references the calculation or table that produced it. A colleague should be able to reproduce the number without repeating the chat. Highlight which conclusions rely on judgment calls such as deduplication rules. Do not let the model invent background reasons for a pattern in the absence of external evidence.
Make the audit repeatable on the next export
Save an audit pack containing the original file checksum, data contract, parsing steps, row counts, error register, reconciliation ledger, chart data, and reviewed summary. Include who authorized the data upload and when the numbers were confirmed. The next file can be run through the same checks; changes in column names or null patterns become visible exceptions rather than silent differences in the final slide deck.
A useful release gate asks five things: Is the row grain consistent? Are key fields sufficiently complete? Are duplicates handled explicitly? Does one authoritative total reconcile? Can every reported number be traced to a calculation? If any condition fails, return the analysis for correction. AI earns trust through inspectable work, not through fluent wording.
How We Research
On October 27, 2026, we checked the following named primary-source materials: OpenAI data analysis with ChatGPT, Microsoft Power Query profiling, ChatGPT file upload considerations. This article is an editorial workflow and source-based product description, not a claim of completed hands-on benchmarks, access to customer accounts, observed test results, or guaranteed outcomes. Examples, numerical placeholders and proposed test cases are instructional; readers must verify their own real values. Plan access, permissions, AI settings, availability and documentation change. Recheck product sources and consult appropriate administrators before making account or customer-facing changes.
Frequently Asked Questions
OpenAI documents spreadsheet and CSV analysis with tables, calculations and charts, subject to file limits, model capabilities and account settings.
Not without checking the grouped table, denominator, units, filters and source reconciliation. Appearance does not establish analytical accuracy.
No. Define the entity key and investigate the cause. Some apparent duplicates are legitimate repeated events or separate order lines.
Use only data your organization authorizes for the selected service, minimize identifying fields and follow applicable retention and privacy controls.
An independently computed control total compared with the cleaned dataset, alongside an explicit explanation of every exclusion or adjustment.