
Converting a detailed report into a presentation is a compression task, not a decoration task. An AI tool can draft slide titles and layouts quickly, but it may omit exceptions, blend separate findings or turn cautious language into confident marketing copy. The remedy is to establish a claim map before asking for a slide deck.
This guide shows a report-to-slide workflow using documented import capabilities in Gamma and Copilot for PowerPoint. It covers source selection, charts, speaker notes and final review. Neither tool should be considered a fact-checker simply because it starts with a file.
Decide the audience and one takeaway per slide
Before importing the document, write the decision the presentation should support. A board meeting may need investment risks and options; a training session needs clear actions; a research briefing requires method and uncertainty. Select five to eight takeaways that are actually supported by the report.
For each proposed slide, note the source page or section and the intended question it answers. Do not let AI invent a new storyline from only the executive summary. Record which details are too technical for slides and belong in speaker notes or a linked appendix.
Create a claim-to-source map
Make a small table with slide claim, report quote or data location, qualification and owner. Preserve units, dates, denominators and definitions. If the source says “sample respondents” rather than “customers,” keep that limitation. An executive slide with a missing denominator can mislead even when the percentage itself is copied correctly.
Mark unresolved or disputed numbers before generation. Where a report contains charts, use the underlying table if available rather than a screenshot. A screenshot may lose editability and make it hard to detect whether a scale or annotation changed during conversion.
Use Gamma imports with a defined editing objective
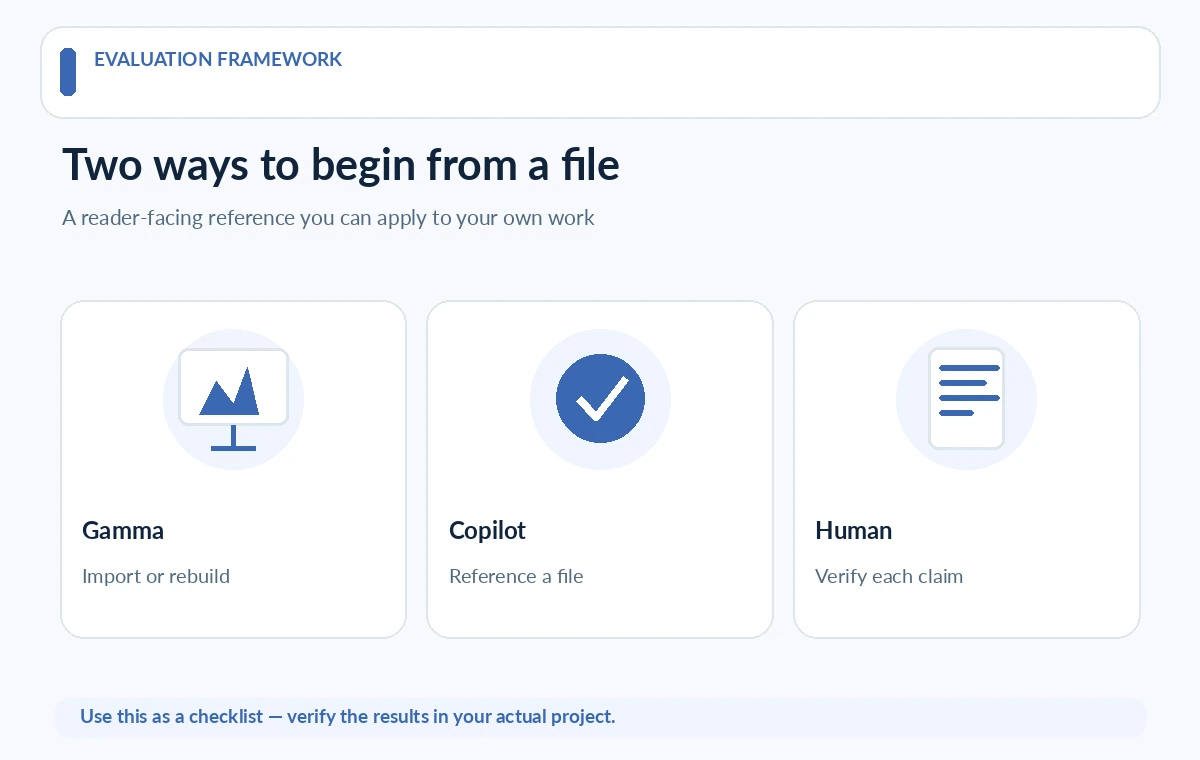
Gamma’s current help describes Gamma 5 imports from Word, PowerPoint and PDF files. It distinguishes preserving an existing layout from using source content to create a new presentation, and notes that some imported charts may remain static images. State clearly whether the goal is faithful import or executive condensation.
Ask Gamma to keep claims and figures unchanged, produce an outline first and flag sections requiring manual review. If an imported chart is static, rebuild it from verified data or retain the original with a visible source. Treat output fidelity as something to check, not an automatic guarantee.
Use Copilot in PowerPoint from an approved file
Microsoft documents creating presentations from a file and adding individual slides grounded in a selected source. Availability depends on licenses and organizational settings, so confirm the exact workflow in your tenant before writing staff instructions. Point the request to the relevant report section when possible.
Create the draft and inspect whether it includes the required caveats. Copilot may suggest images and speaker notes; review each for relevance. An invented illustration of a facility, product or customer can imply first-hand evidence where none exists. Replace it with a labeled conceptual diagram if the photo cannot be sourced.
Rebuild numbers and visuals for slide-sized reading
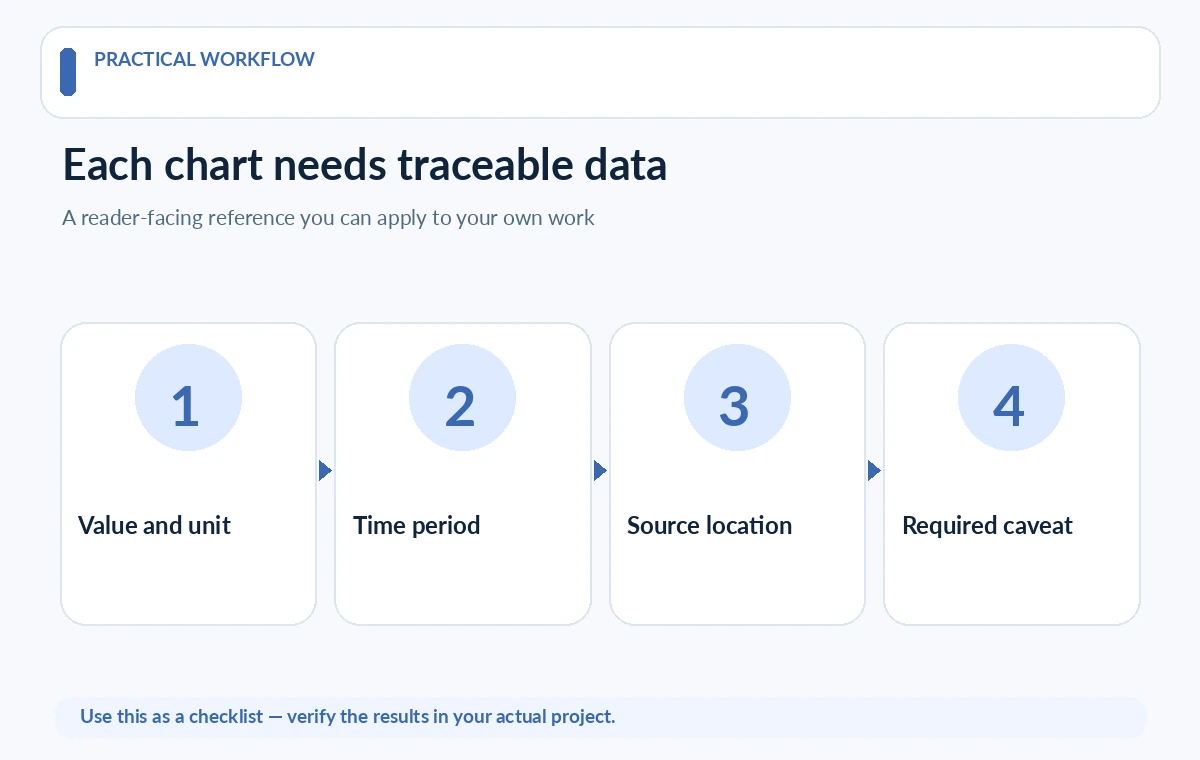
A report table may have twenty columns; a useful slide often needs two or three comparable measures with a clear denominator. Remove nonessential detail only after preserving the meaning. Label chart units, period and source on the slide, and keep a link to the complete dataset in notes or an appendix.
Check that zero baselines, percentages and ranking directions remain correct. Never show a chart that the AI generated from a verbal claim without comparing it to the actual report. Avoid turning a range, modeled estimate or scenario into an observed fact.
Write notes that retain caveats rather than hiding them
Speaker notes can explain methodology, sample restrictions and the conditions under which a recommendation holds. Write one short paragraph per slide with the exact source reference. If a conclusion rests on two incompatible reports, state the disagreement rather than smoothing it into a false consensus.
Add a question the presenter may face and the relevant supporting citation. This turns a decorative deck into a usable briefing. Avoid promising that all audience questions can be answered from the generated material alone; subject expertise and source review are still required.
Run an accessibility and usability pass
Give every slide a unique title, use high-contrast text and provide alt text for meaningful visuals. Microsoft recommends checking object reading order because screen readers may follow a different sequence from the visual layout. Run its Accessibility Checker and inspect the Reading Order pane, especially after custom arrangements.
Present the exported deck on the actual screen size. Check whether axis labels are legible from the back of a room and whether important distinctions rely only on color. Export a PDF or PowerPoint copy as needed, then reopen the result to catch dropped fonts, cropped content or corrupted charts.

Use a final audit before sharing the presentation
Read every title as a claim and find the supporting report location. Verify all dates, quantities, labels and acronyms. Confirm the deck contains relevant caveats, has permission to use its images and is distributed only to the intended audience. Sensitive report extracts may require approval before upload to an AI service.
Record the source version and date used. If the report changes after the presentation is made, the deck may need a fresh audit rather than a cosmetic update. A polished slide is still a secondary summary: the authoritative source remains the underlying report and its reviewed evidence.
How We Research
Research reviewed October 27, 2026. Primary product and accessibility sources: Gamma 5 import documentation; Microsoft Copilot create from file; Microsoft slide accessibility. We compared only capabilities described in official documentation with the reader task addressed by this article, noted when vendor documentation does not establish measured performance or legal clearance, and structured editorial checks that readers can reproduce with their own materials. We did not purchase plans, run independent benchmarks, verify private accounts, or claim affiliate relationships. Plan terms and interfaces can change; confirm them with the provider before purchase or publishing.
Frequently Asked Questions
Gamma describes PDF import and editable content, but some charts may remain static images. Check each chart after conversion and rebuild from verified data when needed.
Microsoft supports generating content from selected files, subject to licensing and processing limits. Verify the available feature and select relevant sections rather than assuming unlimited context.
Not without verification. Compare values, units, scale and date with the original table or authoritative report before presenting.
Important qualifications that change the audience’s interpretation belong on the visible slide. Longer method explanations and references may be placed in speaker notes.
There is no universal ratio. Start from audience decisions and supported takeaways, then use appendices or notes for supporting material.