
A production AI debugger is different from a chatbot that guesses why a code snippet fails. In a live incident, the useful evidence includes which service is affected, when the failure began, what changed, and what logs, traces and error events show. A fluent root-cause explanation can still be wrong if the agent cannot see a relevant dependency or deployment event.
This guide examines two documented approaches, Sentry Seer and Datadog Bits Investigation, and describes a safe incident workflow for using them. It does not claim we ran a head-to-head outage benchmark, and it does not substitute for an organization’s incident command or on-call policy. Use the selection criteria to evaluate coverage in your own telemetry stack before enabling additional access.
Start with an incident record, not an open-ended prompt
Write the observable symptom and its scope: elevated errors in checkout requests, timeout spikes in one region, or failed background jobs after a deployment. Record the first known time, affected environment, customer impact, and links to the supporting dashboard or issue. Do not guess the root cause in the problem statement. The investigating system should be able to consider several explanations rather than merely confirm your first theory.
A useful prompt might ask: investigate the rise in payment-service timeouts between two recorded timestamps, compare error traces with deployment events, and list evidence for and against each hypothesis. Replace example values with your actual incident record. Avoid sending customer identifiers, credentials or raw personal data in free text when access-controlled telemetry can answer the question.
Compare the data context each investigation system can see
Sentry documents Seer as an AI debugging agent using issue details, tracing, logs and profiles together with code context. Datadog documents Bits Investigation as an agent that works across metrics, APM traces, logs, change tracking and other supported telemetry. The platform that already contains your correlated data may have an advantage in setup, but data quality and access configuration matter more than a product name.
Make an inventory of important systems: web tier, queue workers, database, dependency calls, mobile clients and recent deployments. Mark which signals exist and which can be accessed by the agent. If you have only stack traces, the system may explain an exception but lack the evidence to determine why its frequency suddenly increased. Missing telemetry is an investigation limitation, not an excuse to invent certainty.

Collect a hypothesis with its supporting and contradicting evidence
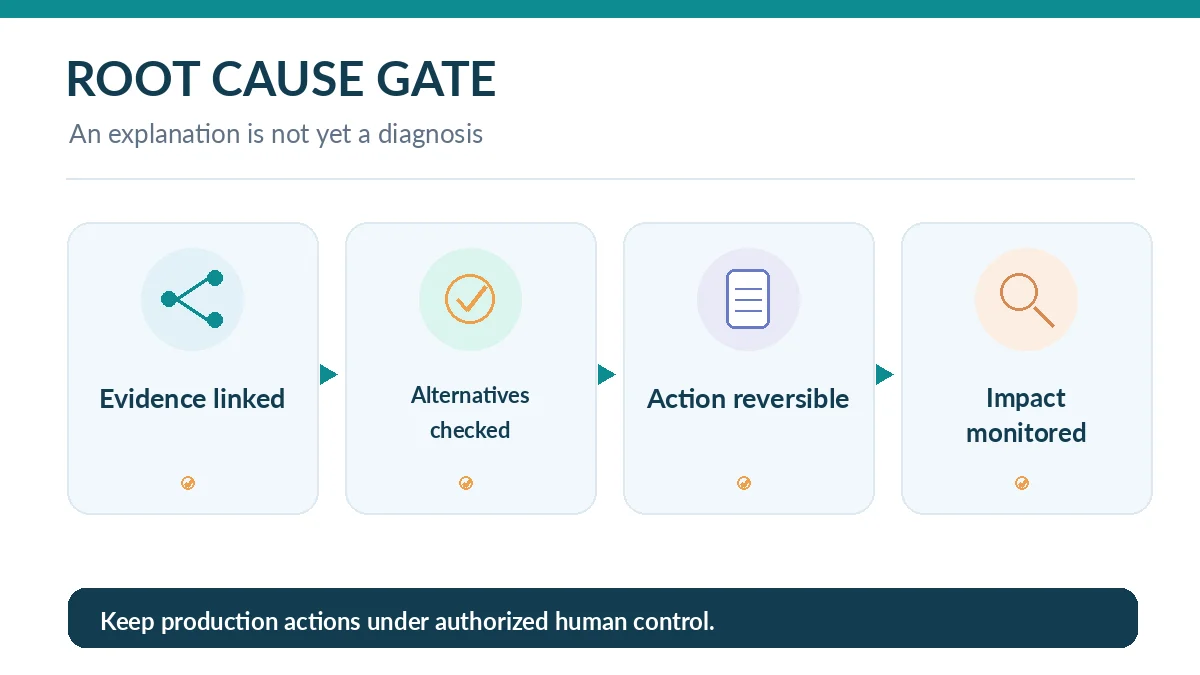
Ask the assistant to show the relevant trace, error group, event time range and recent changes behind each proposed cause. Distinguish correlation from causation: a deployment and an error spike happening together do not prove the deployment caused the issue. Look for a behavior change specific to affected requests and a plausible mechanism such as exhausted connections, invalid configuration or a slower dependency.
Datadog’s documentation explicitly allows an investigation to end inconclusively when the evidence is insufficient. Adopt that standard internally. A credible incident note says “suspected due to these traces; not yet validated” until a controlled check supports the claim. Keep a separate list of unknowns, and invite the on-call engineer to challenge the top hypothesis before acting.
Use an observation-to-verification loop during mitigation
Decide which action is reversible, then establish a before/after signal. A feature flag, targeted traffic shift or safe rollback may be preferable to rewriting code during an outage; follow your organization’s runbook. Record who approved the action and exactly when it happened. The agent can recommend a check, but a person should execute and monitor changes with customer impact.
Verify whether the relevant error rate, latency and user outcome improved after mitigation. Check secondary symptoms: a fast response is no victory if orders stop entering the database. If the signal does not move as predicted, reject the hypothesis and reopen the investigation instead of declaring a fix based on an AI narrative. Preserve enough evidence for a later postincident review.

Control source-code and incident-data access
Sentry and Datadog can use code context only under configurations that permit the required integrations. Review source-code scopes, retention terms, employee access and any cross-platform integrations with your security team. Datadog lists several optional third-party telemetry sources and preview capabilities; do not assume all are available to every account or should be enabled without approval.
Keep secrets, customer records and privileged log fields outside prompts and investigations unless policy specifically allows them. Give the agent only the permissions needed to investigate. Record access grants and their removal. A system that can propose a patch or remediation is not automatically authorized to execute deployments, rotate credentials or alter production databases.
Evaluate utility with a retrospective incident exercise
Select one resolved, non-sensitive historical incident and assemble the telemetry snapshot available at the time. Ask the tool for hypotheses without revealing the known final answer. Assess whether it highlights relevant signals, identifies missing evidence and avoids overconfident false causes. Compare its output with the actual postmortem and note where the information available to the tool differed.
Do not publish dramatic speed claims from a single retrospective. Measure investigation preparation, human verification effort and the quality of evidence cited, then repeat across different incident types. Include a case with insufficient telemetry; a responsible “inconclusive” answer may be more useful than a quick but misleading recommendation.
Close the incident with an auditable prevention plan
Write separate entries for confirmed cause, contributing factors, mitigation, lasting fix and preventive monitoring. Attach primary trace or log evidence and link code changes and tests. Identify whether alerts fired too late or the team lacked the right service ownership data. Feed these observations back into dashboards and runbooks so the next responder needs fewer guesses.
The goal is not to let an AI agent declare victory. It is to turn correlated telemetry into testable investigation steps while humans remain responsible for production actions. If the assistant’s suggestions cannot be checked against evidence, use ordinary debugging and improve instrumentation before buying additional AI capability.
How We Research
We reviewed Sentry’s Seer product documentation, Datadog’s Bits Investigation instructions and Datadog’s Error Tracking integration notes. The checkout incident and retrospective exercise are illustrative workflows, not experiments performed by LabFin. We do not infer vendor reliability, root-cause accuracy or remediation speed from marketing descriptions. Checked October 26, 2026.
Frequently Asked Questions
No. It depends on accessible telemetry, source context, configuration and the failure mode; a defensible investigation can legitimately remain inconclusive.
Choose according to where your useful errors, traces, logs and changes are connected, then run an approved retrospective with your own incident types.
Not by default. Production changes require authorized ownership, rollback planning, customer-impact checks and verification after the action.
Connect each claim to primary telemetry, consider alternatives and test a reversible prediction before calling the issue resolved.
Include the timeline, observed impact, supported root cause, mitigation evidence, lasting fix, owners and preventive monitoring changes.